Thinking about CTF

One of the question we will ask when setting up collections is what range of defocuses to target for imaging.

This is an important question and the answer affects the entire rest of data processing, so careful consideration should be taken when deciding.

Most of us know the tl;dr

higher defocus = higher contrast

lower defocus = higher resolution

and the inverses.

Some of us will know this handy rule-of-thumb from Radostin Danev:

And hopefully many of us are using this handy CTF calculator from Takanori Nakane at the MRC-LMB

https://3dem.github.io/relion/ctf.html

or maybe this more complex Excel spreadsheet from Henning Stahlberg:

https://www.c-cina.org/tools/soft/ctf-simulation/


But I wanted to provide some of the resources that I consider when trying to dive deeper in reasonable ranges and targets to select.

Aliasing

This is the main aspect of the post I would like to convince you to consider in your next microscope session. Aliasing is when high-frequency signals mimic or “alias” low-frequency signals due to insufficient sampling. The most common real-life example of aliasing is the “Moire effect” you can see when you use your smartphone to take a picture of another display such as your computer monitor.

In the case of the CTF in Cryo-EM, the frequency is a function of defocus and spectral frequency (1 / resolution), and the sampling is a function of the box-size and the pixel size.

Frequency

We can express the CTF as function of spatial frequency \vec{k} as (from Rohou 2015):

CTF(\lambda, \vec{k}, \Delta z, C_s, \Delta \phi, a_c) = -\sin[\chi(\lambda, |\vec{k}|, \Delta z, C_s, \Delta \phi, a_c)]

with \chi(\dots) denoting the wave aberration function:

\chi(\lambda, |\vec{k}|, \Delta z, C_s, \Delta \phi, a_c) = \pi \lambda |\vec{k}|^2 (\Delta z - \frac{1}{2}\lambda^2|\vec{k}|^2C_s) + \Delta \phi + \tan^{-1}(a_c / \sqrt{1 - a_c^2})

Where \lambda is the electron wavelength, \Delta z is our defocus, C_s is the spherical aberration, \Delta \phi is an additional phase-shift (which we will ignore here), and a_c is the fraction of amplitude contrast.

From our early maths studies we have that the period of \sin(Bx) is \frac{2\pi}{B}, so we have for the period of the CTF as a function of absolute spatial frequency (L(|\vec{k}|)).

L(|\vec{k}|) = \frac{2\pi|\vec{k}|}{\chi(\lambda, |\vec{k}|, \Delta z, C_s, \Delta \phi, a_c)}

Sampling

In Digital Signal Processing the Nyquist-Shannon theorem tells us that to faithfully represent a function with a maximal frequency B hertz we need a sampling rate of at least 2B. The sampling rate of the Fourier Transform of our reconstruction is given by:

f_s = \frac{apix \times boxsize}{2}

Where the denominator comes from the symmetry of the Fourier transform, and our sampling step size is given by:

\Delta f_s = \frac{1}{apix \times boxsize}

Which gives us the range of frequencies we expect of DC to Nyquist.

All together now

Putting what we know about the CTF frequencies and how the FFT is sampled we can now solve for the resolution at which the CTF will begin to alias for a given field of view (the box size in Angstrom units).

\frac{2}{f_s} = L

We can expand the terms and rearrange this into a proper polynomial of |\vec{k}|:

\frac{\lambda^3C_s}{2}|\vec{k}|^4 - \lambda \Delta z |\vec{k}|^2 + f_s |\vec{k}| + \frac{\tan^{-1}(a_c / \sqrt{1 - a_c^2})}{\pi} = 0

Solving this will gives us the resolution for aliasing for a given field of view. I have calculated the threshold for a range of defocuses against fields of view below.

By setting the spatial frequency to Nyquist |\vec{k}| = 1 / (2 \times apix) we can solve the polynomial now for box size and determine for a given magnification the minimum box size we need to ensure there will be no aliasing at a given defocus as well. The formula here being:

box size = \frac{\lambda \Delta z}{apix^2} - \frac{\lambda^3C_s}{8\cdot apix^4} - \frac{4}{\pi}\tan^{-1}(a_c / \sqrt{1 - a_c^2})

I have also calculated some of these values as well below:

Delocalisation

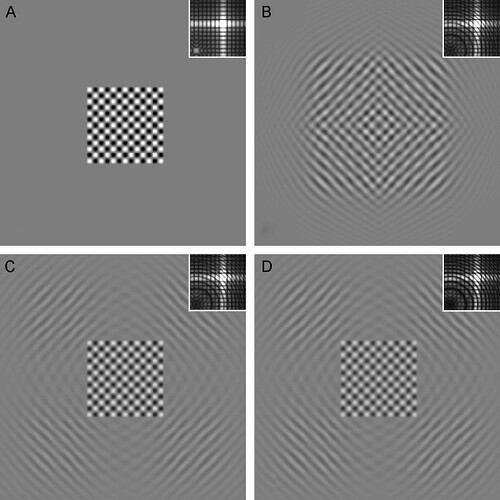
The other point that needs to be considered, once you have taken into account the aliasing effect, is the delocalisation of information by the CTF. This delocalisation is easily seen as the fringes or halos you see in highly defocused micrographs around sharp edges. Some times when the resolution of the micrograph is high you can also see “ghosts”, white colored shadows of usually lattices, far displaced from their related negative contrast density. This delocalisation requires us to even further extend or box size so as to capture all of the delocalised signal. The figure from this paper by Bob Glaeser illustrates how far the signal can extend from the ideal density:

We can characterize the delocalisation mathematically by first taking the derivative of the wave-aberration function we described above.

\frac{\delta (\chi(\dots))}{\delta |\vec{k}|} = 2\pi \lambda |\vec{k}| (\Delta z - \lambda^2 |\vec{k}|^2 C_s)

The amount of delocalisation here is related to the period of a sine-wave of the above derivative in reciprocal space (real-space in this case). So this becomes:

delocalisation = \lambda |\vec{k}|(\Delta z + \lambda^2 |\vec{k}|^2 C_s)

This gives us the additional amount we need to add to our field of view so that we do not throw away any of the displaced information caused by the defocus and CTF, and as plotted below, both higher resolution and higher defocus require us to pad our particles larger and larger to contain the total signal:

Conclusion

I hope this gives you a lot more to think about, and will help you when it comes to deciding pixel size / magnification, and a target defocus range for your next session.

If you have any thoughts, comments, questions, or suggestions. Please let us continue the discussion for those interested below.

Great info! And very well structured!

CTF Explorer

So to make these concepts a little more practical for users I made a small application that will let you fill in your data collection parameters and up to 20 defocuses and it will generate some plots related to the discussion above.

Hopefully you will find it useful and a little cool to play around with.

If you click the button below it will launch an instance so that you don’t have to install anything, but it can take a little bit of time to load up, just be patient.
Binder

The code is here:

2 Likes

Hi Dustin,

This is a really cool tool! I have been playing around a bit now and have some questions on exactly how to read the output graphs - hope you can help me

First, I entered some parameters which are very much like a recent case where we collected at KI.
(top panel in attached pdf)

Though the actual data has not been processed at the physical size, in the playing around using your tool I just imagined to have the particles in a box, not downsampled.
The range of defocus values I just put as the nominal values from collection, not the actual from micrographs after CTF estimation.
(the second and third panels in the attached pdf)

But it seems like some frequencies are actually not covered by this range of defocus values?

Next, I am not exactly sure how to read the graphs related to box size and aliasing.

In the fourth graph panel in the pdf, should I read that the aliasing is only the invariant/vertical part of the curves for the respective defocus values?
If so, in my case here it is only the particles of defocus values around 0.4 um I can expect some aliasing?
And the fifth graph panel, the lower one, should I read this as my box of 800 pix is actually a bit too small to avoid aliasing in particles with 1.5 um defocus or higher?

Finally, the last graph on delocalisation, to me looks like the current box size of 800px (say for a particle of 400px) is too small to encompass the delocalized signal in the higher defocus particle images?
(bottom panel in pdf).

Thanks a lot for your help.

Btw, I was not able to upload more than one picture in my post, hence the single pdf file. Can this maybe be changed for users so that we can add pictures similar to your original post here on CTF?

Best,
Rasmus

Hi Rasmus,

First:
Thank you for sharing your question on the forum!

Yes that is the case it seems with around 3Å and 1.5Å resolution. But it’s considering nominals only, and while you may have less than average signal transfer around these resolutions, deviation from nominal target defocus should lift these up a bit.

It’s also important to note that as long as it is not truly so close to zero, if it is measured correctly, the CTF correction will restore this amplitude because this curve is used to divide the power spectrum of the raw average structure.

So the third graph, the one titled “Resolution Threshold for Aliasing”, shows for a given field of view (given in box size (px) assuming the selected pixel size) what resolution the CTF has a frequency above Nyquist (starts to alias). If the circle is above the exponential falloff or to the right of where the curve falls to zero, then you have no aliasing concerns for the selected resolution. In your attached case you don’t have any aliasing even to Nyquist (if you imagine bringing the open circle straight down).

If the open circle is below the exponential fall-off part of the curve and to the left of where the curve falls to zero then you have aliasing at the selected resolution. This is shown in the picture below where for a box size of 128 and a pixel size of 1Ă… the CTF is only faithful out to around 2.9Ă… and is undergoing aliasing at the selected 2Ă… resolution:

The fourth graph, the one titled “Minimum Boxsize to Avoid Aliasing” shows for a given pixel size what box size you need to avoid aliasing at Nyquist, so again its is similar to imagining the third graph with the open circle fixed at Nyquist. If the open circle is above (or outside to the left) of the hump of the curve then the CTF is correct all the way out to Nyquist as is true in the case you have shown.

If the open circle is below the hump as in the photo below then I need to increase my box size to preserve the CTF. In the photo below I need a box size of at least 168px to avoid aliasing out to Nyquist, or if I don’t expect around 3Å resolution I could decrease the magnification a step and as long as it is larger than 1.2Å pixel size then I’d be in the clear.

Yes, if you have a fixed pixel size then you can only interpret the graph vertically by increasing box size to affect the aliasing. However if you are not fixed to a particular magnification you can adjust your position laterally by changing the mag.

No, you don’t have any aliasing for this box size and pixel size at all, as the open circle is above all of the curves.

Yes you are losing some signal on the edges due to delocalisation, however you are only losing half of the power (as delocalisation moves the signal in opposite directions) since the delocalisation is less than the box size. It just means you need more particles than if all of the signal fit in the box. However, boxes are rarely large enough to fit all of the signal as this graph lets you appreciate, and we just make up for it with more particles.

Discord has some restrictions when you first start using the forum to prevent things like spam, but I will look into changing the number of images that can be posted.

Hope all of that is helpful, and if anything was unclear let me know and I am happy to explain further or to try again in another manner.

Hi Dustin,

Thanks a lot for the explanations and clarifications! This is very helpful.

I played around some more. The parameters are all the same as previously, but I changed defocus values and adding two much higher defocus values.
So given my pixel size of 0.51 angpix and 800px box and 2.2 Ă… resolution (top panel in picture), particles with a defocus value of 2.4 um would be just at the limit of the CTF starting to alias? And all particles with a defoucs value higher than 2.4 um will have CTF aliasing at the resolution?

But say I downsample particles to 1 angpix upon extraction (bottom panel in picture), I can either included particles with defocus values greater than 3.2 um without CTF aliasing or even reduce the box size to 540 px and still have no CTF aliasing?

Best,
Rasmus

Oh, one more thing maybe you can explain a bit more on from a practical pov.
Because, generally I am working on fairly large particles but collecting at physical pixel size 0.51 angpix makes it impractical to extract at physical pixel size in what then becomes huge boxes.
And using your tool now, I can even see that an 800px box is insufficient to avoid CTF aliasing for particles of defocus values greater than 1.5 um, I would have to go 900px box or bigger. But using Rado Danev’s rule-of-thumb equation, I could have particles with defocus value of 2.2 um contributing to 2.2 Å resolution. But a box to encompass CTF without aliasing at such defocus then becomes way too big for reasonable processing times.
This is challenging and so particles are downsampled to for example 1 Ă…/px upon extraction.

My question is then, since we downsample particles anyway, would there be any advantage of collecting data at lower mag, say 1 Ă…/px and then work with particles that are not downsampled upon extraction as compared to collecting at this very high mag and have to downsample particles for the sake of box size? Do you know if it makes a difference in Relion in terms of CTF refinements and polishing to have non-downsampled vs. downsampled particles?

Best,
Rasmus

Yes this is correct.

Yes this is also correct because you didn’t change the box size to correspond with the down sampling. In the first graph you have a field of view of 400Å and then in the second graph the F.O.V. has now doubled to 800Å. So if you don’t have aliasing at 540 box size at 1Å, then correspondingly you wouldn’t have aliasing also at around a 1080 box size at your original sampling rate. This was explained here in the original post:

But in the application I changed the X-axis to box size at the selected sampling because that I feel is more practical in usage.


So here Rado’s trick is just a quicker estimate whereas in the application you are using the full derivation from the CTF, it’s a little tricky because when you have aliasing you are still technically calculating the correct values of the CTF, there is just not sufficient sampling in the FFT to support it as the proper oscillation. Obviously the safest thing to do is avoid the aliasing, but even with some there is probably still room to recover the signal to a level so it safe to estimate in favor of allowing higher defocuses than to over estimate the cutoff and suggest lower defocuses.

The advantage here is solely one of increasing the number of particles with the larger field of view. This requires another post that I will make now that you have raised it, but it is better to collect at a higher mag and then down-sample than to collect at the lower magnification and not down-sample because of the DQE of the camera. If you are not particle limited, in an image sampled at 0.51Ă… and then down-sampled to 1Ă… considering a resolution of 2.2Ă… you have the DQE dampening this signal much less here at half-Nyquist than if you consider that same resolution when sampled at 1Ă… and not down-sampled where you now have the DQE of the detector very near Nyquist where it is performing at its worst.

There is no difference here that I am aware of.

Hope that helps and again let me know if anything didn’t make sense or needs clarification. I will work on a post on DQE in the coming weeks because I think you raise an interesting question that others have as well.

Best,
Dustin

Hi Dustin,

I am bit confused. Here you treated under-sampling of CTF in the reciprocal space and PSF in the real space as two different issues. I think these two are actually the same. I mean that when the real space box size is large such that CTF aliasing in the reciprocal space is absent, all signal that spreads from the center of the (real space) box is contained within the box, and vice versa (but see Note 1 below).

Let’s consider the frequency of CTF oscillations. High frequency in the reciprocal space means “farther from the center” in the dual space, i.e. the real space. This means that, the more rapid the CTF oscillates, the larger the width of the (real space) PSF is. The CTF aliasing happens when this frequency exceeds the Nyquist frequency of the reciprocal space, which corresponds to the edge of the real space box. Thus, CTF aliasing in the reciprocal space and signal spreading beyond the real space box are the same thing. (Sorry, the terminology is a mess! I hope you understand what I mean.)

The pixel size of the reciprocal space is \Delta k = \frac{1}{boxsize \times apix} [\unicode{x212B} ^{-1}].

The argument of the CTF, i.e., \chi(k), changes between neighbouring (reciprocal space) pixels by

\chi(k + \Delta k) - \chi(k) \approx \frac{\partial \chi}{\partial k} \Delta k = \frac{2 \pi \lambda \Delta z k - 2 \pi \lambda^2 C_s k^3}{boxsize \times apix}.

We want this to be smaller than \pi, so we get

boxsize \times apix > 2 \lambda \Delta z k - 2 \lambda^2 C_s k^3.

This is the same conclusion as what you derived in the “delocalization” section. You missed the sign of the C_s term (the partial derivative is correct). The factor of two comes from the fact that the signal spreads in both directions; the box size must be twice the amount of delocalization.

I feel the formula you derived in the “All together now” section is wrong. Why the box size depends on the amplitude contrast (and phase shift)? They are constant with respect to k and do not change how fast the CTF oscillates. Thus, it shouldn’t appear in a formula related to CTF aliasing.

Note 1: For real particles with a finite size, the box size has to be larger than the above formula to accommodate signals originating from pixels not in the center of the box. In discrete Fourier transform, we assume periodic boundary condition, so (real space) signal that goes beyond a box edge comes back from the other side. This does not happen in the reality.

Note 2: Needless to say, \chi(k + \Delta k) - \chi(k) \approx \frac{\partial \chi}{\partial k} \Delta k is an approximation. To be more precise, we have to consider the power spectrum of -\sin \chi(k) truncated at the resolution of interest, which is not analytically solvable.

Note 3: In the presence of envelope functions, the PSF becomes even larger. A narrower function in the reciprocal space means a wider function in the real space.